Below you will find the main methodological characteristics of MapBiomas Argentina for producing land cover and land use maps and transitions between different years.
You can access the ATBD (Algorithm Theoretical Basis Document) with a complete description of the methodology and algorithms by following the link:
MapBiomas Argentina Collection 1 – ATBD
MapBiomas Argentina Colección 2- ATBD COL2
The ATBD is a document that is updated in each collection with new information and learnings. There is a General ATBD for MapBiomas Argentina with a set of annexes detailing specific characteristics in the classification of different regions.
GENERAL CHARACTERISTICS
All annual land cover and land use maps of the MapBiomas Argentina are produced from the pixel-by-pixel classification of Landsat satellite images. The whole process is carried out on the Google Earth Engine platform which offers immense cloud processing capabilities.
BASADO EN IMÁGENES LANDSAT (Resolução 30 MT) | PROCESAMIENTO PIXEL POR PIXEL (30 X 30 MT) | PROCESAMIENTO BASADO EN LA NUBE. |
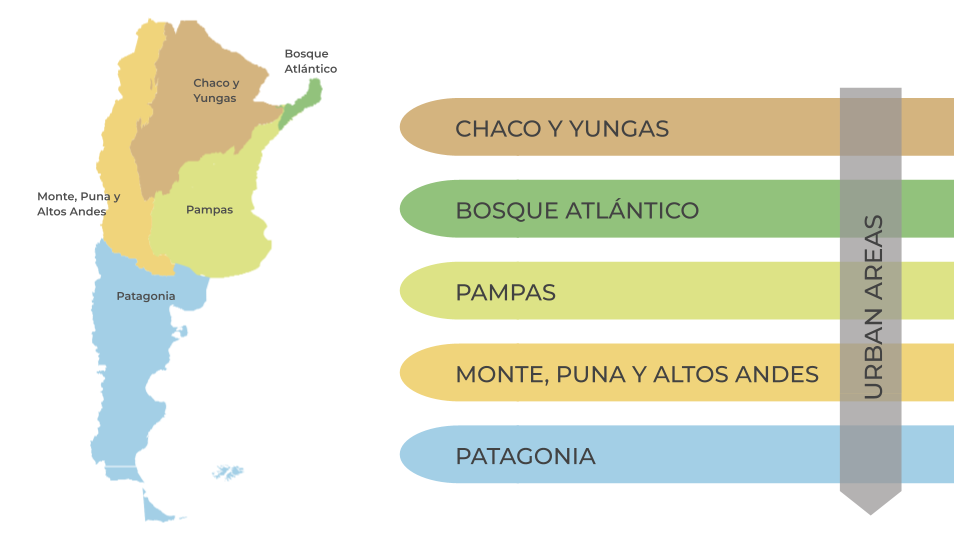
HOW WE ARE ORGANIZED
Para realizar el mapeo, los equipos especialistas en teledetección, ecología, sistemas de información geográfica y programación se organizan en 6 equipos de trabajo; 5 corresponden a regiones: chaco y yungas, el bosque atlántico, pampa, puna, el monte y altos andes y patagonia que cubren la totalidad del territorio argentino. El sexto, es un grupo de trabajo transversal que mapea las áreas urbanas de todo el país. De forma tal que se cuenta con equipos idóneos y con conocimientos del terreno cubriendo la extensión y diversidad de paisajes.
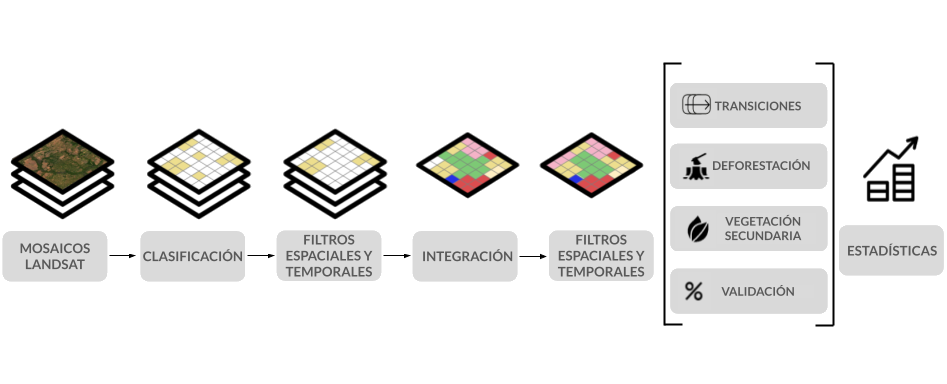
METHODOLOGY OVERVIEW
The diagram below illustrates the main stages of the process for generating annual land cover and land use maps and transitions for MapBiomas Argentina.