
CONOZCA LAS ETAPAS DE LA METODOLOGÍA DE MAPBIOMAS ARGENTINA
Here we detail step by step the methodology of MapBiomas Argentina. For each class treated in the map, there are particularities and specific characteristics that can be consulted in detail in the ATBD.
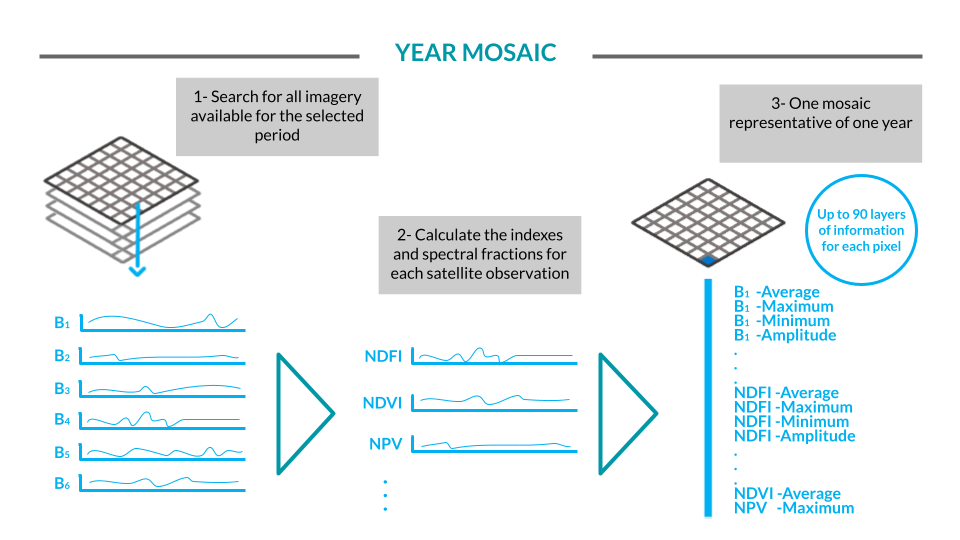
Landsat satellite images, with a resolution of 30 meters, are processed and made available free of charge on the Google Earth Engine platform for a time series of more than 40 years. The images may contain clouds, shadows, smoke, etc., which can “contaminate” them. To produce a clean image, cloud-free pixels are selected from the images available for the selected period. For each of these pixels, metrics are selected that explain the behavior of the pixel in that year. This is done for each of the satellite's spectral bands, as well as for the calculated spectral fractions and indices.
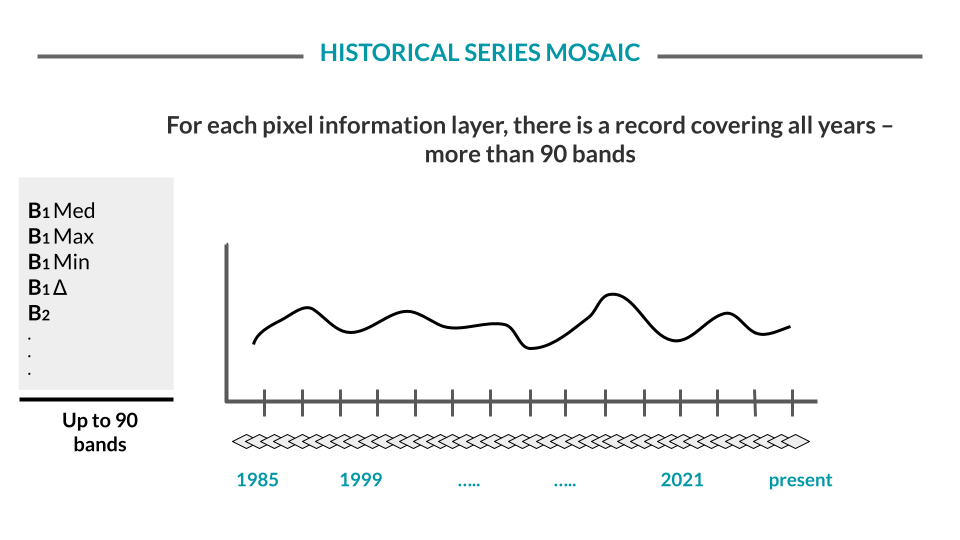
For each year, a mosaic covering the entire country is created, representing the behavior of each pixel through 104 metrics or layers of information. This set of mosaics is saved as a data collection within the Google Earth Engine platform. These mosaics are used in two main ways. First, as a source of parameters for the algorithm to classify the images (see next step). This mosaic is also used to generate the RGB composition that allows visualizing the background image on the MapBiomas platform. This composition is also used to collect training samples and evaluate accuracy through visual interpretation.
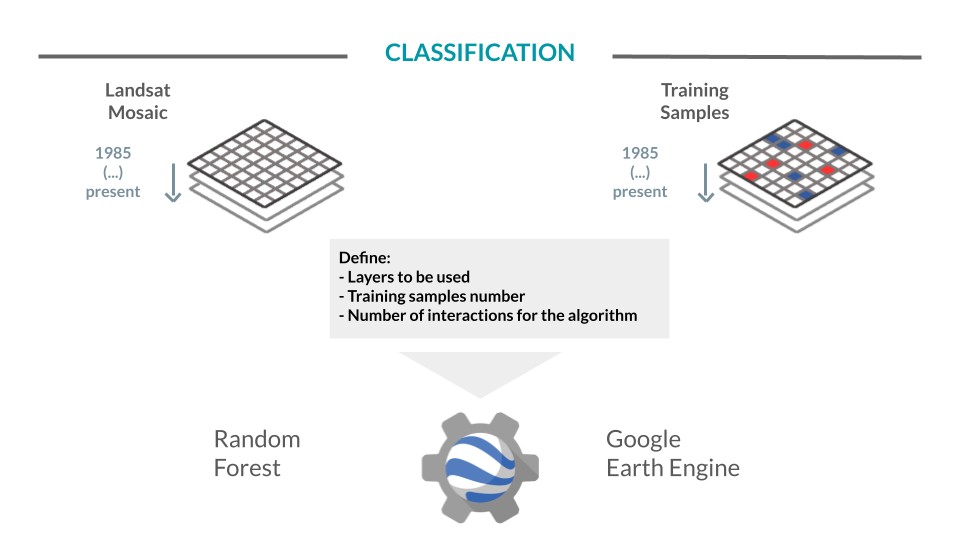
From the image mosaics, the land cover and land use map is developed (woody, non-woody natural, agriculture, pasture, non-vegetated area, water bodies, etc.). To do this, analysts at MapBiomas Argentina use an automatic classifier called "random forest," which runs on Google's cloud processors. This system is based on machine learning: for each class to be classified, the algorithm is "trained" with samples of the targets to be classified. These samples are obtained through reference maps, generation of stable class maps from previous series of MapBiomas Argentina, and direct collection of complementary samples through visual interpretation of Landsat images.
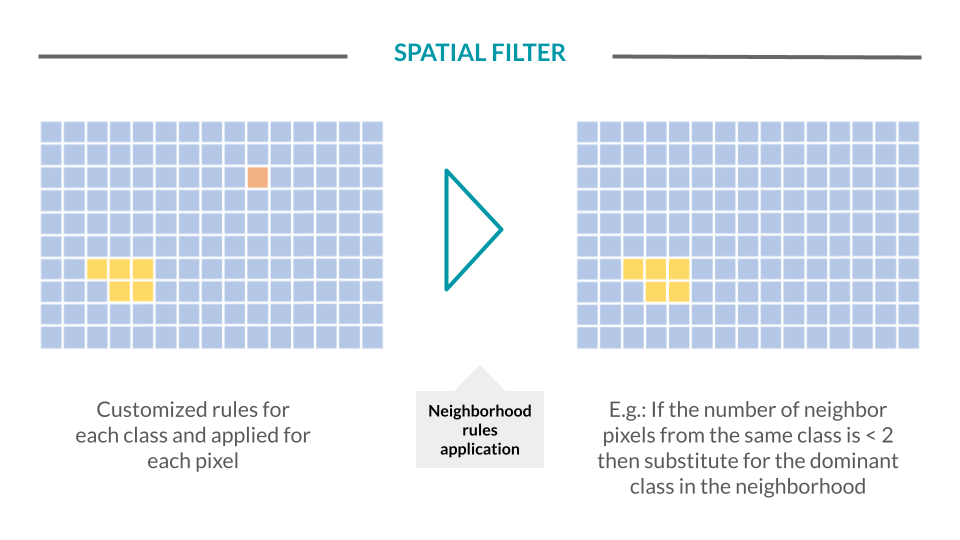
The spatial filter aims to increase the spatial consistency of the data by eliminating isolated or edge pixels. Rules of neighborhood are defined that can lead to a change in the classification of pixels. For example, a pixel that has fewer than two of its nine neighboring pixels in the same class will be reclassified to the predominant class in the neighborhood. The filter is applied to all classes and years of the collection.
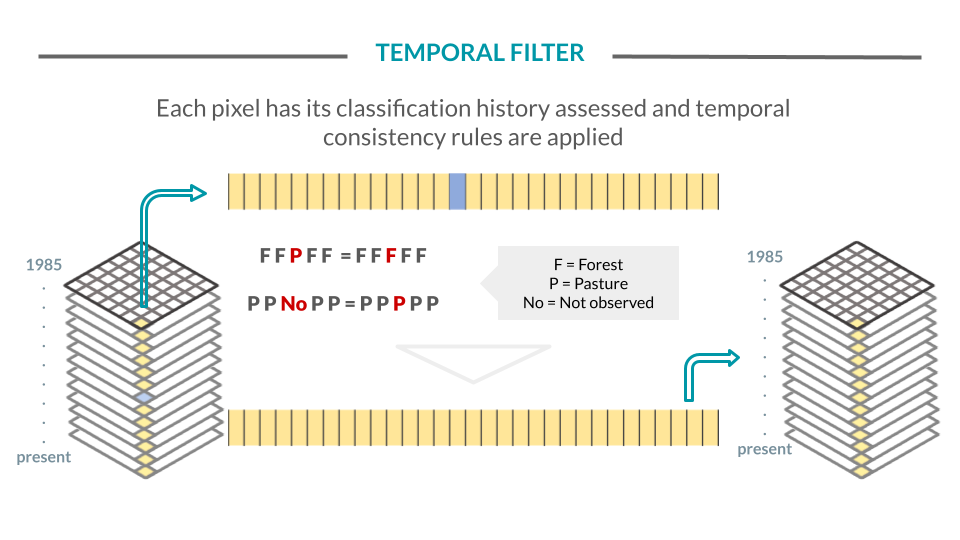
Para reducir las inconsistencias temporales, en particular cambios en la cobertura o el uso que son imposibles o no están permitidos (por ejemplo, Bosque > Agricultura> Bosque) y para corregir fallas debido al desbordamiento de nubes o falta de datos, se aplica un filtro temporal. Cada clase puede tener reglas de filtrado temporales específicas. El filtro temporal se aplica a cada píxel analizando todos los años de la Colección.
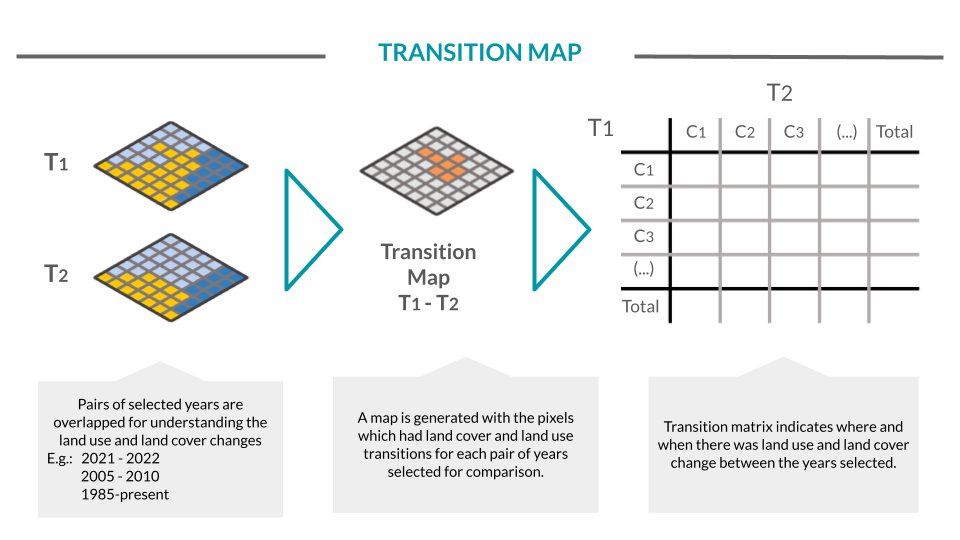
To understand changes in land cover and land use, maps with class transitions between different pairs of selected years are produced. This allows for the analysis of changes in the territory and answers questions such as how much of the woody class converted to pasture from one year to another. Transition maps are generated pixel by pixel and, once completed, they are also subjected to a spatial filter to eliminate isolated or edge pixels. Transition matrices are constructed from these maps for different territorial divisions available on the MapBiomas Argentina platform.